Collective (2020) – a heart wrenching account of how public officials and investigative journalists sought to bring awareness and justice for the 64 people who were killed, and 146 who were injured, in a preventable nightclub fire in 2015.
How did Ceaușescu’s rule of Romania come to an end? – a 20 minute account of the Timisoara uprising that led to the toppling of the Ceausescu regime.
To see Ceausescu’s speech on December 21st and the exact moment where he realised that it was all over, see here; to see him being tried, and shot, see here.
Welcome to my four part series on transition. Join me to understand more about the transition from communism to capitalism in Central and Eastern Europe, and the battle between the Russian oligarchs and the current Putin regime.
To listen to the lectures as a podcast just paste this RSS feed into your favourite podcast app (if you use Apple Podcasts select Library > … (More) > Follow a show by URL.
Part 1: “Steps in the Dark: Why socialist calculation is impossible” (YouTube | Vimeo | SoundCloud)
In the first of this four part series we see why capitalism became the only economic system left standing.
Part 2: “Economic transition in Central and Eastern Europe: Shock therapy or gradualism?” (YouTube | Vimeo | SoundCloud)
In the second of this four part series we understand more about the circumstances following the end of the USSR, and the alternative transition strategies that former communist countries faced.
Part 3: “The Oligarchs: How the new tycoons rose to power” (YouTube | Vimeo | SoundCloud)
In the third of this four part series we look at how a new type of business leader emerged in Russia and took advantage of the transition process.
In the fourth of this four part series we uncover how Putin came power, how he gained control of the Russian economy, and how he has disrupted the global geopolitical order.
Credits: Thank you to Simulus for recording and editing the content.
I have another lecture in this series, on Fukuyama’s ‘End of History’ thesis and how this relates to Eastern Europe, identity politics, and populism. I intend to record that as a live talk, so if you’re interested in hosting me get in touch!
2025, “Revealing the Benefits of Trade to University Students” in Rangeley, Max, and Hannan, Daniel, (Eds.) Free Trade in the Twenty-First Century, Springer (with Wioletta Nawrot)
2015, “The financial crisis in the United Kingdom. Uncertainty, calculation and error” in Boettke, Peter J., and Coyne, Christopher J., (Eds.) The Oxford Handbook of Austrian Economics, Oxford University Press
From time to time I decide to host a public webinar. They are typically based on content that I wouldn’t use in any of my formal courses, but I want to make sense of by presenting to an audience. The topics are often a result of a request or an offshoot from another lecture.
These events and are not intended to be sharp and insightful and I do not profess to have an original take or an important perspective. In most cases I am just trying to make sense of a topic, and am arranging what I’ve read about it. But if you like me lecture style and want the chance to sample some deeper but less rehearsed content then this might be for you.
Unlike my online teaching you do not need video or engagement. You can dip in and out and are welcome to leave when you need to. Consider it a drop in clinic. The format is simple: 1 hour talk, and I’ll stick around for any questions.
Although many markets today are virtual, it is important to recognise the culture and tradition contained within long standing physical market places. Known as one of the biggest open air markets in Europe, Porta Palazzo is also one of Turin’s most popular tourist attractions. It contains a wide range of different stalls, exemplifying the bustle and atmosphere of routine commercial activity. It has historically been the centre for people’s livelihoods, their access to goods and services, and their social identity. The market serves multiple purposes:
Food distribution
Tourist attraction
Community resource
I’ve been coming to teach in Turin for many years, but only found out about Porta Palazzo when I read Rachel E. Black’s anthropological study. So on my visit in November 2023, I took a quick taxi ride from the ESCP campus to have a look around. The outdoor market meets the covered part at its entrance:
The inside section is a labyrinth with multiple vendors selling whatever meats, fish and bread you can imagine. Behind the counters some stalls have ladders leading up to their hidden storage areas, and vendors serve you from a height.
I was particularly impressed by the variety of animals and cuts of juicy meat!
There is a “new” section of the market, which is modern, quieter, and more civilised. But it’s familiar and a little boring.
Across the road there is the open air market, and at first I made my way through stalls selling household items.
I even found a Porta Palazzo truck!
The most colorful and lively area by far contains the fruit and vegetable stands. Here, vendors are at the same level as their customers, and there is much greater noise and discussion.
Here are some of the orange and clementine stalls:
Like many markets, the pace of activity changes throughout the course of the day. It tends to be busiest around meal times, and better deals are made just before it closes. Across Italy, people are most likely to visit markets on weekends, but they are usually closed on Sundays.
Notice how many shoppers – especially older ones – wheel a trolley bag with them. Some of the younger customers appeared to be buying in bulk for commercial purposes.
There are several reasons why markets such as this have an older demographic. It can often be a combination of factors such as:
Low prices
Habit
More free time
Social aspects
Convenience
I also noticed younger vendors on the periphery of the market, selling mint and other fresh herbs.
These tended to be immigrants, who are becoming an increasingly important source of custom for markets across Italy.
I’ll finish this photo essay with the words of Rachel Black:
Although it is easier to focus on the big picture of the market as an institution, the complexity, personalities, and passions of the people who participate make markets truly extraordinary places. Through the people and their daily interactions, the marketplace takes on life and meaning. The time I spent in markets taught me that these are not waning sites of tradition and history; they are dynamic places of lively sociability that resist homogenization and remain open to the general public. Markets have always embraced globalization as a force that creates diversity and encourages social, economic, and cultural exchanges across borders and barriers, making them extremely timely institutions that have the potential to bring people together and help create community. Black, 2012, p. 180-181
This page presents a wide range of resources that have contributed to my interest in the post-Soviet transition from communism to capitalism. I intend to collate and highlight exceptional portrayals of the transition process in the former Soviet Union and other communist countries.
The Transition Lectures
For my four part lecture series on transition, see here.
Traumazone, by Adam Curtis
This collection of BBC archival footage provides a fascinating and absorbing insight into how life changed for ordinary citizens of the Soviet Union, from 1985 through 1999.
A 6 hour documentary based on Daniel Yergin and Joseph Stanislaw’s classic book. View them in sequence in the playlist below:
Other documentaries
The Second Russian Revolution, BBC – According to the show notes, “The acclaimed documentary series from 1991 that examined political in-fighting in the Soviet Union and the battle for perestroika.”
Life in Moscow, 1986 – A look at life in Russia featuring several expats. Available on YouTube:
Bald and Bankrupt – a British vlogger who travels around the former Soviet Union providing a glimpse at the legacy of communism. I particularly liked this video, filmed one day before the Russian invasion of Ukraine:
Good Bye Lenin! (2003) – Set in East Berlin, a woman falls into a coma and misses the fall of the Berlin Wall. When she awakens her children don’t want to shock her, and attempt to screen the economic changes occurring outside the bedroom window. This is an entertaining but poignant demonstration of the transition process and alternative economic systems.
The Lives of Others (2006) – An enthralling depiction of the East German Stasi, with the main character questioning the implementation of his ideals whilst spying on a playwright. There’s no neat ideological conclusion, but a challenging portrayal of espionage.
Leviathan (2014) – A wonderfully presented tale of eminent domain and the bureaucracy and corruption that come with it. I was expecting a battle between man and the state, but it was more of a Vodka-fuelled truel than a duel. (Also contains a fascinating side plot with regard to how it was funded.)
Bhasker calls himself a “democratic socialist” but I maintain that this is an aspirational label rather than one that can be understood in theory or demonstrated in practice. While the left attempt to grapple with their history of actually-existing-socialism, I think it is wise to go with capitalism, which is the only system that seems to work so far. It’s also notable that Bhaskar’s magazine, The Jacobin, is well designed and popular, but routinely misrepresents free market economics and is geared towards activism rather than serious enquiry.
Regardless of collectivist aspirations, this interview recognises that the essence of socialism is a centrally planned economy. Mack uses camping trips as a model of “the good society” but I think this suffers from three flaws. When it comes to a camping trip, the participants already know each other; everyone has consented to participate; and there’s no need to create resources (camping trips are primarily about consumption rather than production. If you want to drink a beer, you bring it with you having paid for it with previously expended labour). This reveals that most socialist visions are utopian and don’t solve the real world problems of how to create human flourishing in an extended social order. Ultimately, socialism is a collectivist philosophy that requires subjection of the individual to the whole. Therefore it should be rejected by anyone whose fundamental concern is the dignity and sanctity of the individual.
This interview makes clear that the main tragedy of socialism is that it is unintended. The results are inconsistent with the stated goals of the advocates, implying the problem is an intellectual one. Hence the need for scholarly enquiry and public education. They also recognise that a centrally planned economy may function better than a market economy during times of war, but this should not be the model. After all, a stable peace is as important a social objective as greater wealth. This interview also captures Pete Boettke’s biggest contribution to economics: in the absence of the “three P’s” of property, prices, and profit and loss you have to rely on political power to allocate resources. Therefore, a socialist society will be riddled with rent-seeking and the other inefficiencies associated with “politics without romance“, giving rise to the nomenklatura and priviledge. He also makes the point that prices are embedded in institutions, and institutions are embedded in broader social relations. We therefore need to understand law, politics and society, as a coherent social science. Finally, I like the point made that a free market economy lets ordinary people do extraordinary things. It doesn’t rely on extra ordinary people controlling and directing a vast bureaucracy.
Memoir of a British Journalist in Moscow, Cold War Conversations – an interview with a Morning Star journalist who provides a sympathetic view on life under communism.
This course equips students with an understanding of how useful economics is for energy professionals. The Micro part of the course covers market design and the interpretation of price information, and relates this to the challenges posed by disruptive technologies such as artificial intelligence. The Macro part looks at the changing nature of the energy industry, including new technologies, sustainability objectives, and geopolitical implications. The course presents this material in an integrated way and challenges students to become effective problem solvers in both individual and team-based settings.
Last year 15 hours of this module was delivered online. I have made a modified version of that course available as an optional extra, aimed at students who have not studied economics before. You will need to create a (free) wordpress account to access it, but you can find it here: https://lms.anthonyjevans.com/courses/energy-economics/.
“I, Pencil” (Leonard Read, 1958, Foundation for Economic Education)
“What is Seen and What is Not Seen” (Frederic Bastiat, 1850, Paris: Guillaumin. This version taken from The Bastiat Collection, 2nd Ed., Mises Institute, 2007, pp. 1-11 only)
“Sarah Paine – How Russia sabotaged China’s rise“, Dwarkesh podcast, September 18th 2024 – a good overview of Chinese-Russian relations, emphasising how often China’s ambitions have been undermined by Russian interference, and the massive shift in relative power since the end of the Cold War.
Richard Feynman explains how “fire is stored sunshine” (and therefore most energy is solar)
Corrections
Crude oil has been discovered and utilised across the world throughout history, but the “first commercial oil excavation” took place in the 1850s either in Azerbaijan, Poland, Romania or the USA. The modern oil industry though is said to have begin in Pennsylvania.
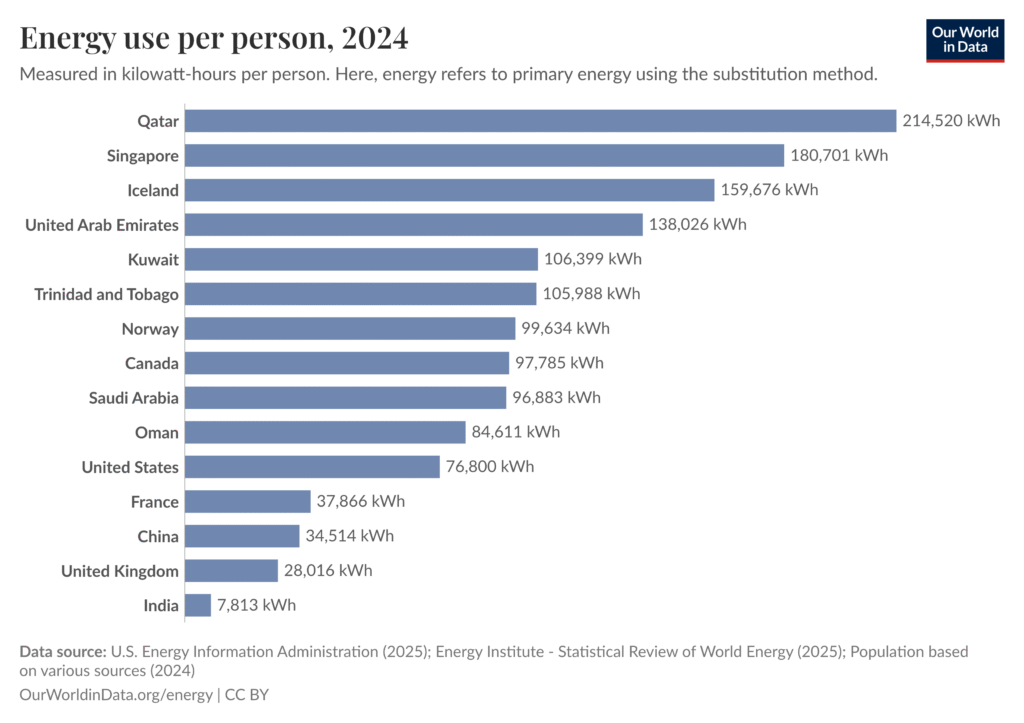
The country with the highest energy use per person is Qatar. NOT Canada. Here is the top 10 (plus other selected countries):
This course provides an overview of core economic concepts and how they relate to senior executive management. Particular focus will be placed on the theory and practice of internal markets and how organisations have harnessed the knowledge and incentives provided by market mechanisms. Group work will focus on an analysis and assessment of the macro context for a relevant country, looking at monetary and fiscal policy as well as a broader set of social and environmental indicators.
60% Final exam (online) – the best way to revise for the exam is the quizzes used during the course, such as Managerial Insights, India, and Macro trends.
Course handouts: will be made available during the course
Pre class activities
Please read all of the information below carefully in order to prepare for the course. The textbook references are background materials and can be read anytime. The required materials should be read or watched in advance. At the end of Day 1 I will be referring to the 2016 film ‘Arrival’. Here’s a trailer. If you’ve not already seen it, I suggest familiarising yourself with the plot (spoiler alert). Or better still, watch it!
1. Why don’t you take attendance at the start of class?
The first 15 minutes of the class are very important and I do not want to devote them to administrative tasks. I also want to pretend that you turn up to learn something, and not purely because you require proof of being present. You are expected to be present for the entire duration of the session and therefore it shouldn’t matter when I take attendance, but I normally do so at the start of the break. It is your responsibility to ensure that you are marked as present before leaving the class.
2. Why don’t you make all of the content from your lecture slides available?
As a professional educator one of my main concerns with the prevalence of digital content is the impact it has on a student’s ability to gather, synthesize, and critically engage with content. I try to ensure that all of my live sessions are unique and generate content that requires attention and consideration. For this reason I strongly encourage students to take notes, and debrief with group members, instead of relying on the provision of solutions, punchlines, or board plans at some future date. There are three types of powerpoint content that I reveal in class and aren’t visible in the PDF lecture handouts. They are either:
Answers – these are intended to be a surprise and therefore I don’t want you to be able to see them in advance.
Images – for design reasons these often can’t be simultaneously shown alongside the text, and would also use a lot of ink if printed.
Confidential information – in these cases I don’t want the material to potentially circulate on the internet.
You should therefore treat this information the same as something I write on the whiteboard or say verbally, where the burden is on you to take notes rather than rely on handouts. Recognising what is pertinent and what is not is a key part of your obligations as a learner. This is also a reason why student attendance is important, since there is a necessity to be present in class to receive all of the necessary information. For the same reason that I don’t provide copies of my whiteboard plans or recordings of class, some powerpoint content is deliberately restricted.
Rest assured that I pay close attention to what is and isn’t within the PDF handout. If it is something relevant for an exam then it will be easy for you to fill in the gaps. If the information is relevant, but not necessarily important, you will be able to find out more either through a footnote or the additional resources on my website. In any case, if you feel that you didn’t capture some relevant information, whether it was communicated via powerpoint, on the whiteboard or verbally, just let me know and I’d be happy to help your revision. Part of my responsibility as an instructor is to ensure that you do not finish the course missing any important information. But your responsibility as a student is to be in charge of absorbing what happens in the classroom.
3. Why don’t you provide a word count or expected number of pages for assignments?
Because then I would also need to provide guidance on font size and other details that detract from your ability to establish, for yourself, an appropriate length and format.
4. What is an “open book” final exam?
You will take the exam on your own laptop and are allowed to consult any notes. The exam is “open book” in the sense that you can use course materials. However, you may not use your laptop (or any other electronic device) to communicate with anyone (e.g. another student or a LLM such as ChatGPT). The purpose of the exam is to test your knowledge of the content, rather than your ability to use the internet to find answers to questions. Therefore obtaining help from someone/anything else during an exam (whether it’s a fellow student or an AI) is a serious offense and will result in disciplinary action. You can use your device to access course materials. You may not use it for communication.
5. How do I get full marks on a MCQ?
For full marks you need to select all of the correct answers. Depending on the intended difficulty level and the software being used it may not be obvious how many of the provided answers are correct. This is to ensure that you consider each one carefully. Partial credit will be available in some instances.
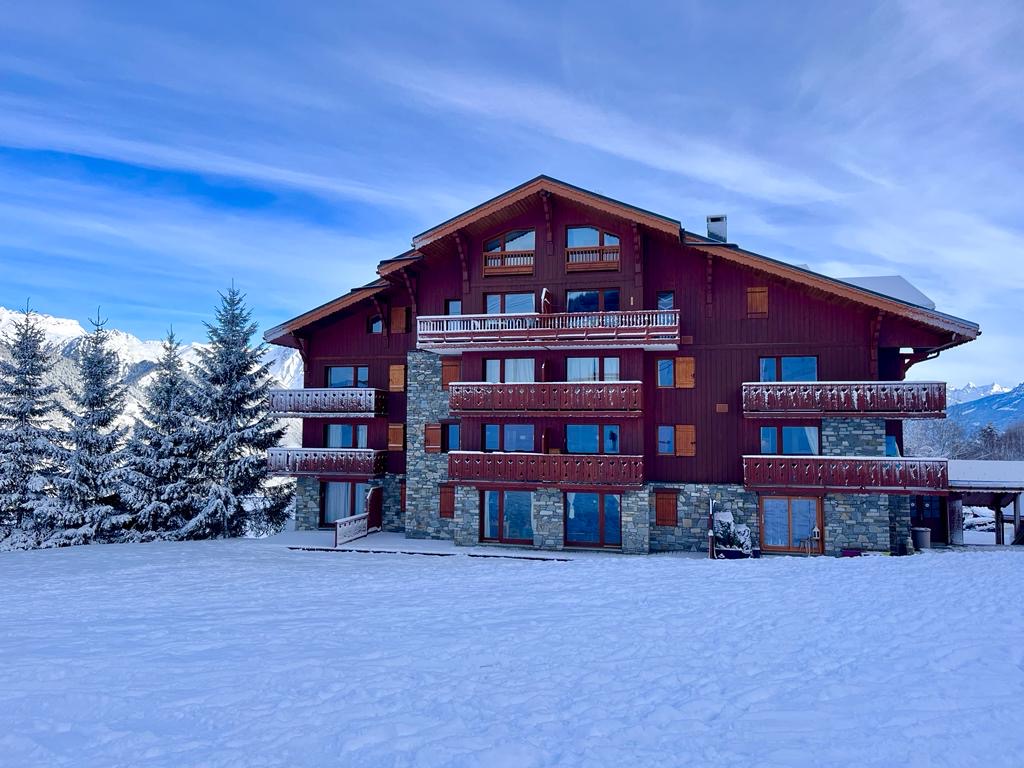
We have a 2 bedroom apartment in the family-friendly ski resort of La Plagne Montalbert. It has a master bedroom and a smaller bunk room making it perfect for a family of 4, and the sofa bed in the lounge means that it can cater for 6. Located on the second floor, the balcony overlooks the piste and provides hours of entertainment and afternoon sun.
❇️ How to get there
Montalbert is a 2 hour drive from Lyon or just over 2 hours from Geneva. Both airports are served by low cost flights with usual car rentals available.
Aime station is at the bottom of the valley (11km away), and easy to reach either by taxi (15 minutes) or a regular bus service (via Altibus). Eurostar have historically run a special service during the ski season with direct trains from St Pancras (although return journeys had to depart from Bourg-St-Maurice, which is 23km or half an hours drive). Now, you can buy a single ticket for £125 each way that involves a quick and easy connection in Lille (see here). That service only runs on the weekend, but Aime is around 5hrs from Paris Gare du Lyon so getting a normal Eurostar and TGV is a cheaper option (there’s even more options if you’re also willing to change at Chambery). For more see the Man in Seat 61. You can also get a Flixbus to Paris for around £20, but it takes 9.5hrs!
We are 976km from Calais which is around 9 hours of driving. It can be done in one day, but France has plenty of clean and affordable hotels at convenient stops along the way (we use Novotels). The toll roads are fast and efficient and it’s much more pleasant to drive through France than the UK. There are two ways to reach Calais:
There are regular and cheap ferry services from Dover, from £80 per trip (see P&O or DFDS)
The Eurotunnel (now known as Le Shuttle) is usually around £140 but takes just 35 minutes and goes from Folkestone.
❄️ Winter
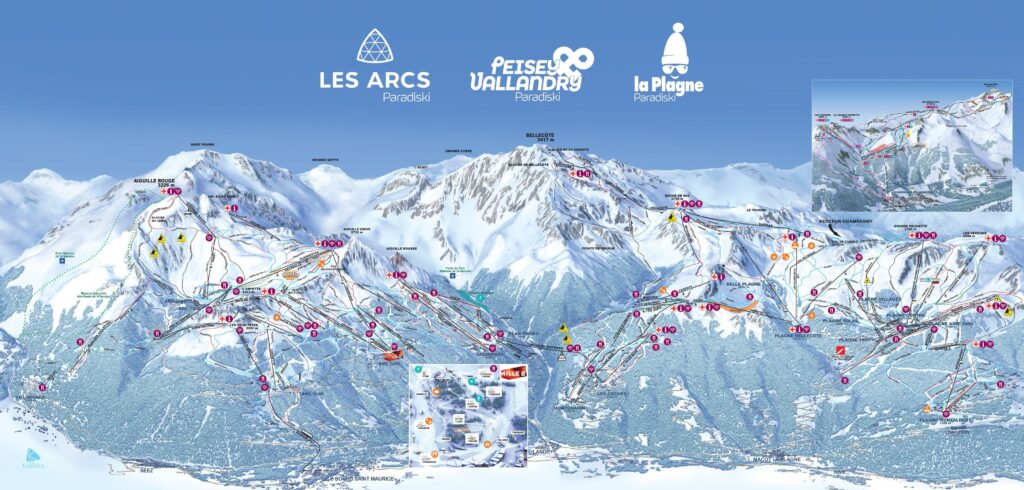
La Plagne is world famous for its size and array of runs. Best suited for all rounders and families, there are enough black runs to challenge serious skiers but the main places are accessible via blue runs. Best of all the Vanoise Express connects La Plagne with Les Arc, providing over 400km of ski runs, 70% of which are above 2,000ft. There are also 18 separate “fun zones” and new activities and lifts are added each year.
Montalbert is a charming mountain village which makes it a suitable place to vacation all year round. Outside of the ski season there are plenty of amenities and the summer wildflowers are stunning. The gondola still operates and this allows walkers to reach the higher mountains. Mountain bikers can take ski lifts up several runs and enjoy the descent. For more see this summer guide, or a trail map for Mont Jovet.


 Course introduction