Prosperity
⭐ Required readings:
- Evans, Anthony J., 2020, Economics: A Complete Guide for Business, London Publishing Partnership (Chapter 12, Section 2)
| Activity: America quiz |
Watch: The Magic Washing Machine
| Lecture handout: Prosperity* |
- Some more detail can be found in “Rosling’s Charts“.
- I also recommend browsing through “Our World in Data“
| Activity: Stoves Handout, May 2020 // Here are the Stoves charts |
In the lecture I argue that infant mortality figures are better proxies for living standards than life expectancy. As Hans Rosling argues, “this measure takes the temperature of the whole society” (p.20). This is because children are fragile, and you therefore require lots of good circumstances in order for children to routinely survive – it tells us about access to basic health care, the literacy of mothers, etc. In this video, Hans Rosling argues that most od the world is better off than you think:
And here’s the magic washing machine:
Although washing machines are magic, Tim Harford (“50 Things that Made the Modern Economy”) has argued that we now tend to have more clothes and wash them more regularly, and therefore haven’t actually saved much time. Therefore, a better example of a household technology that has unambiguously increased leisure time may be TV dinners and other forms of processed food. (And yet people are now pushing back against “ultra processed food”, unfortunately).
America
Here is the documentary by Peter Santenello in America’s poorest region:
In the lecture I included some data on the long term declines in violence. You can see more about this in Steven Pinker’s Enlightenment Now, but one common rejoinder is US gun crime – around 45,000 Americans die each year due to firearms (see Johns Hopkins Annual Gun Violence Data.) According to this article by Pew Research, gun murder rates have increased in recent years, but are still below their 1968 values. 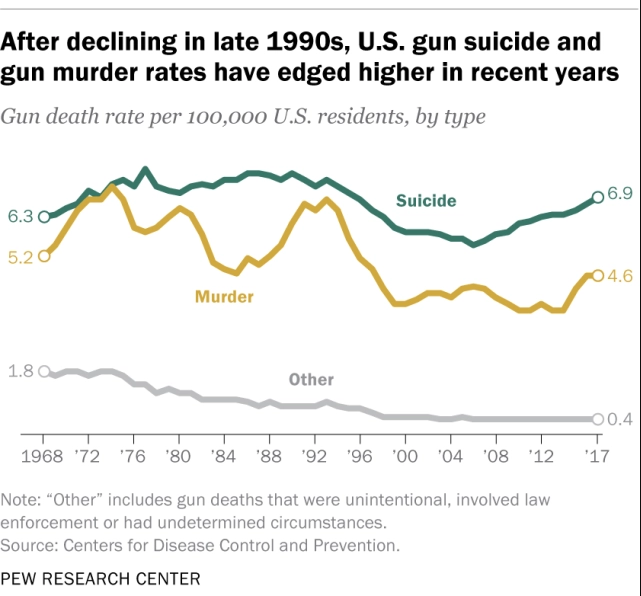
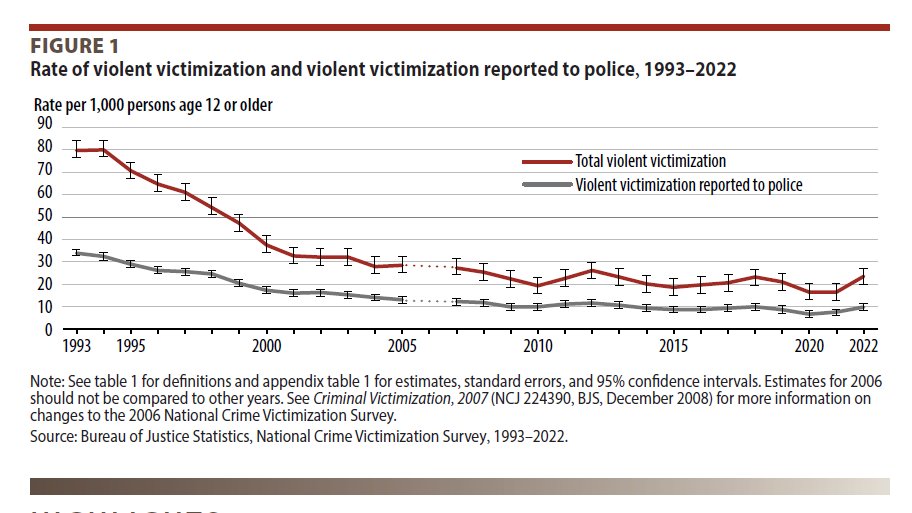
Similarly, this chart shows a recent rise in violent crime, but within the context of a steady decline since the early 1990s:
If you think America is scary today, it was much more scary in the past.
The murder rate in New York peaked in the mid 90s.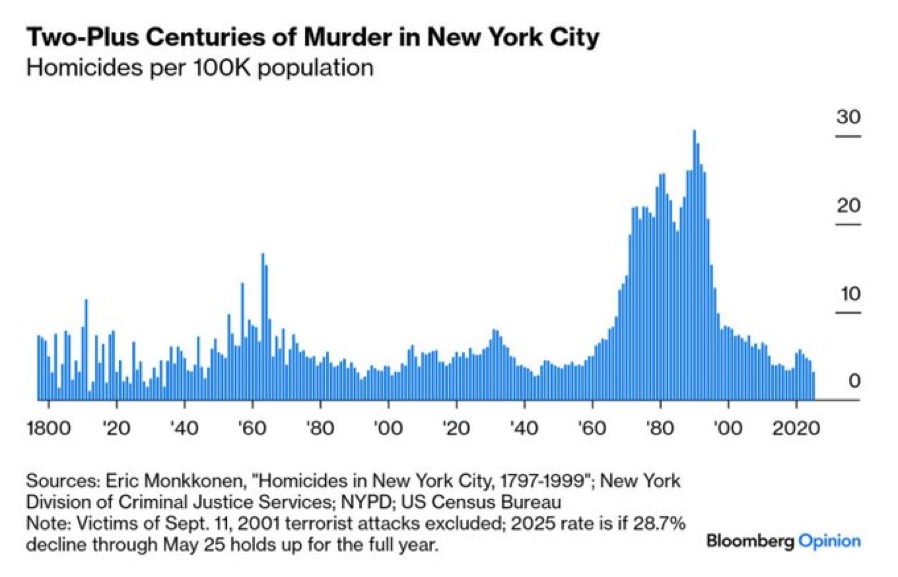
Serial killers are much less prevalent nowadays, having peaked in 1980s.

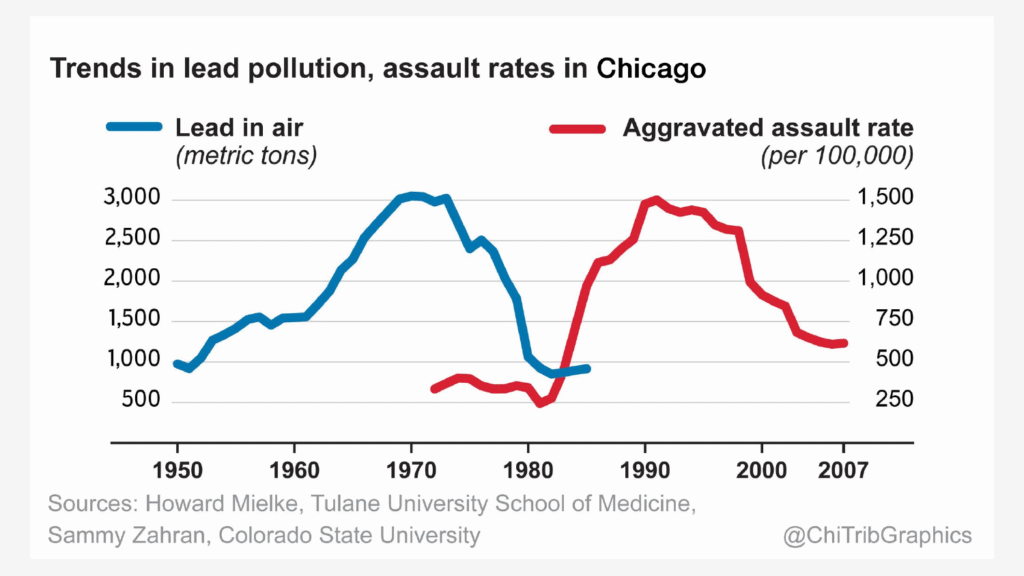
Popular explanations for the spike in serial killers include political turmoil, the decline of the family unit, and even television. Dario Amodei has noticed that styles of murder follow fads (and that the serial killers of the 1970s and 1980s were since replaced by mass shooters in the 1990s and 2000s). One important factor, as Jessica Reyes has argued, is that violent crimes seem linked to lead exposure.
In fact, Caroline Fraser’s 2025 book, “Murderland: Crime and Bloodlust in the Tie of Serial Killers” (see this review by Gideon Lewis-Kraus in the New Yorker) argues that the particular prevalence of serial killers south of the Seattle area was due to proximity to ore-processing facilities that had entered the water supply. We can probably attribute around 28% of the decline in murder rates to be a result of lead abatement.
Another important reason is the development of interstate highways, which gave dangerous people an ability to travel around the country in a way that exceeded law enforcement ability to detect and monitor. Combined with the prevalence of hitchhiking this perhaps explains why increased aggression manifested itself in serial killing. (Note that this wasn’t the only problem caused by the interstate system: they also destroyed major cities. According to Maxwell Tabarrok, “The interstate highway system was a massive, government sponsored negative externality!”)
According to Lewis-Kraus – the subsequent decline was due to “surveillance camera, phone tracking, interjurisdictional cooperation, DNA evidence… [and] interpersonal paranoia” (also see this discussion). In “The Economic Origins of Mass Incarceration” Clegg and Usmani argue that an underdeveloped welfare state contributed to the rise. Perhaps the best explanation for the subsequent fall – made by Zimmering in The City that Became Safe, is more and better policing. But if you want a simple answer for why crime has fallen, it is that we all carry mobile phones (see Ed West).
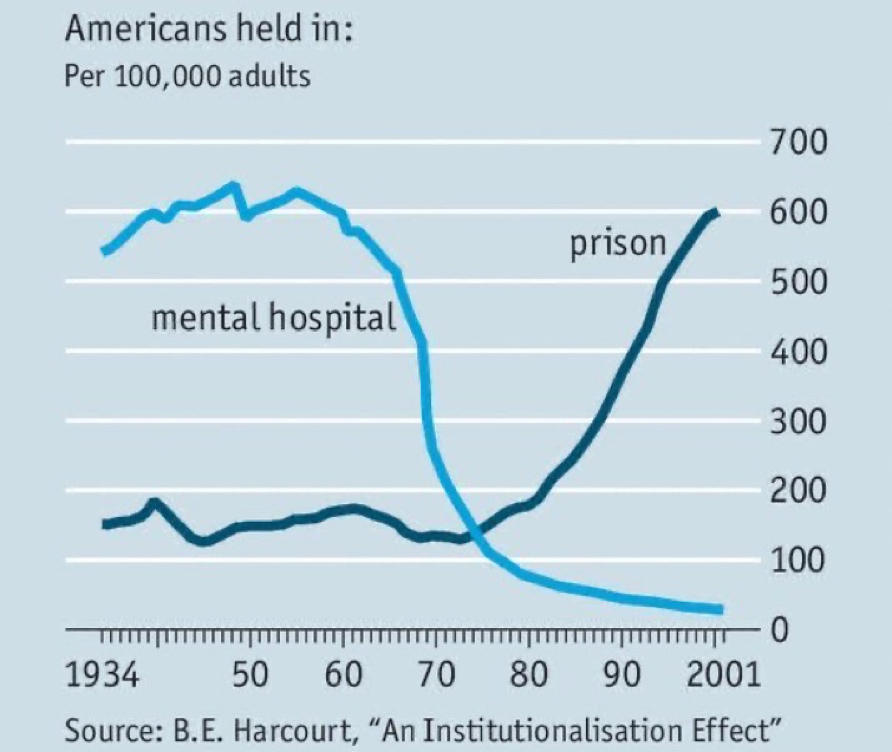
There was also a trend away from institutionalising people with mental illness and toward community based care. This, combined with returning war veterans, led to a large increase in homelessness and prison. In fact, the rise in incarceration perfectly mirrors the decline in institutionalisation.
Finally, we also need to consider context. Compared to European countries, America has a high homicide rate.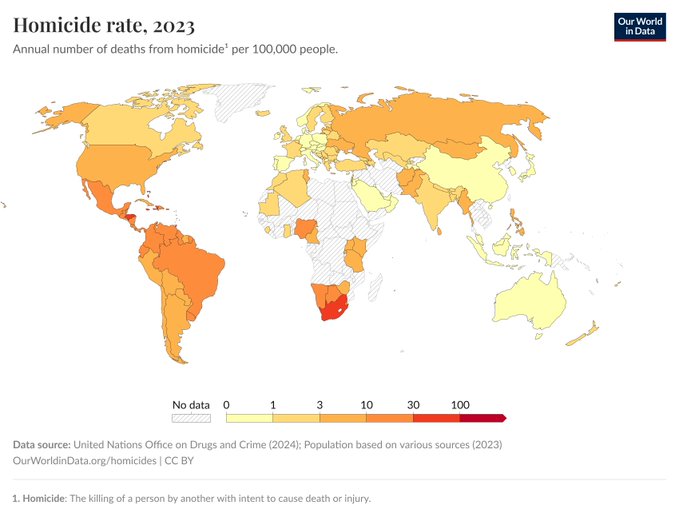
But why make that comparison? Channelling Bob Lawson (via Vincent Geloso), “People think the U.S. is poorly functioning European country. In reality, the U.S. is more like a super-performing and highly functional Latin American nation”. (Note: Canada does look more like Europe, but that’s another question!)
Additional reading:
- Cox, W. Michael, and Richard Alm, “How Are We Doing?”, The American July/August 2008 – unfortunately I can’t find an online version of this
- This review of Bryan Burrough’s 2015 book, ‘Days of Rage’, highlights a separatist movement that “bombed NYC like 300 times, killed people, shot up Congress, tried to kill POTUS (Truman). Nobody remembers it.” They “bombed 2 theaters in the Bronx, injuring eleven, in 1970. [And yet] NYT gave it 6 paragraphs.” For those who think street violence is new, “You have to understand: in 1968, many radicals absolutely believed that the United States was getting ready to collapse.”
The Days of Rage was not only a US phenomenon. From 1971 to 1980 terrorists attacked various embassies 48 times (Macintyre, The Siege, p.186).
Recommended podcasts:
- “360. Fear City: New York in the 1970s” The Rest is History podcast (second half only)
| Learning Objectives: Understand the empirical evidence around economic growth and globalisation
Focus on diversity: Esther Duflo has done highly impactful research on the role of RCTs in combating poverty. She has shown how field research is an important part of the economics toolkit. |