Welcome to my four part series on transition. Join me to understand more about the transition from communism to capitalism in Central and Eastern Europe, and the battle between the Russian oligarchs and the current Putin regime.
To listen to the lectures as a podcast just paste this RSS feed into your favourite podcast app (if you use Apple Podcasts select Library > … (More) > Follow a show by URL.
Part 1: “Steps in the Dark: Why socialist calculation is impossible” (YouTube | Vimeo | SoundCloud)
In the first of this four part series we see why capitalism became the only economic system left standing.
Part 2: “Economic transition in Central and Eastern Europe: Shock therapy or gradualism?” (YouTube | Vimeo | SoundCloud)
In the second of this four part series we understand more about the circumstances following the end of the USSR, and the alternative transition strategies that former communist countries faced.
Part 3: “The Oligarchs: How the new tycoons rose to power” (YouTube | Vimeo | SoundCloud)
In the third of this four part series we look at how a new type of business leader emerged in Russia and took advantage of the transition process.
In the fourth of this four part series we uncover how Putin came power, how he gained control of the Russian economy, and how he has disrupted the global geopolitical order.
Credits: Thank you to Simulus for recording and editing the content.
I have another lecture in this series, on Fukuyama’s ‘End of History’ thesis and how this relates to Eastern Europe, identity politics, and populism. I intend to record that as a live talk, so if you’re interested in hosting me get in touch!
Although many markets today are virtual, it is important to recognise the culture and tradition contained within long standing physical market places. Known as one of the biggest open air markets in Europe, Porta Palazzo is also one of Turin’s most popular tourist attractions. It contains a wide range of different stalls, exemplifying the bustle and atmosphere of routine commercial activity. It has historically been the centre for people’s livelihoods, their access to goods and services, and their social identity. The market serves multiple purposes:
Food distribution
Tourist attraction
Community resource
I’ve been coming to teach in Turin for many years, but only found out about Porta Palazzo when I read Rachel E. Black’s anthropological study. So on my visit in November 2023, I took a quick taxi ride from the ESCP campus to have a look around. The outdoor market meets the covered part at its entrance:
The inside section is a labyrinth with multiple vendors selling whatever meats, fish and bread you can imagine. Behind the counters some stalls have ladders leading up to their hidden storage areas, and vendors serve you from a height.
I was particularly impressed by the variety of animals and cuts of juicy meat!
There is a “new” section of the market, which is modern, quieter, and more civilised. But it’s familiar and a little boring.
Across the road there is the open air market, and at first I made my way through stalls selling household items.
I even found a Porta Palazzo truck!
The most colorful and lively area by far contains the fruit and vegetable stands. Here, vendors are at the same level as their customers, and there is much greater noise and discussion.
Here are some of the orange and clementine stalls:
Like many markets, the pace of activity changes throughout the course of the day. It tends to be busiest around meal times, and better deals are made just before it closes. Across Italy, people are most likely to visit markets on weekends, but they are usually closed on Sundays.
Notice how many shoppers – especially older ones – wheel a trolley bag with them. Some of the younger customers appeared to be buying in bulk for commercial purposes.
There are several reasons why markets such as this have an older demographic. It can often be a combination of factors such as:
Low prices
Habit
More free time
Social aspects
Convenience
I also noticed younger vendors on the periphery of the market, selling mint and other fresh herbs.
These tended to be immigrants, who are becoming an increasingly important source of custom for markets across Italy.
I’ll finish this photo essay with the words of Rachel Black:
Although it is easier to focus on the big picture of the market as an institution, the complexity, personalities, and passions of the people who participate make markets truly extraordinary places. Through the people and their daily interactions, the marketplace takes on life and meaning. The time I spent in markets taught me that these are not waning sites of tradition and history; they are dynamic places of lively sociability that resist homogenization and remain open to the general public. Markets have always embraced globalization as a force that creates diversity and encourages social, economic, and cultural exchanges across borders and barriers, making them extremely timely institutions that have the potential to bring people together and help create community. Black, 2012, p. 180-181
This page presents a wide range of resources that have contributed to my interest in the post-Soviet transition from communism to capitalism. I intend to collate and highlight exceptional portrayals of the transition process in the former Soviet Union and other communist countries.
The Transition Lectures
For my four part lecture series on transition, see here.
Traumazone, by Adam Curtis
This collection of BBC archival footage provides a fascinating and absorbing insight into how life changed for ordinary citizens of the Soviet Union, from 1985 through 1999.
A 6 hour documentary based on Daniel Yergin and Joseph Stanislaw’s classic book. View them in sequence in the playlist below:
Other documentaries
The Second Russian Revolution, BBC – According to the show notes, “The acclaimed documentary series from 1991 that examined political in-fighting in the Soviet Union and the battle for perestroika.”
Life in Moscow, 1986 – A look at life in Russia featuring several expats. Available on YouTube:
Bald and Bankrupt – a British vlogger who travels around the former Soviet Union providing a glimpse at the legacy of communism. I particularly liked this video, filmed one day before the Russian invasion of Ukraine:
Good Bye Lenin! (2003) – Set in East Berlin, a woman falls into a coma and misses the fall of the Berlin Wall. When she awakens her children don’t want to shock her, and attempt to screen the economic changes occurring outside the bedroom window. This is an entertaining but poignant demonstration of the transition process and alternative economic systems.
The Lives of Others (2006) – An enthralling depiction of the East German Stasi, with the main character questioning the implementation of his ideals whilst spying on a playwright. There’s no neat ideological conclusion, but a challenging portrayal of espionage.
Leviathan (2014) – A wonderfully presented tale of eminent domain and the bureaucracy and corruption that come with it. I was expecting a battle between man and the state, but it was more of a Vodka-fuelled truel than a duel. (Also contains a fascinating side plot with regard to how it was funded.)
Bhasker calls himself a “democratic socialist” but I maintain that this is an aspirational label rather than one that can be understood in theory or demonstrated in practice. While the left attempt to grapple with their history of actually-existing-socialism, I think it is wise to go with capitalism, which is the only system that seems to work so far. It’s also notable that Bhaskar’s magazine, The Jacobin, is well designed and popular, but routinely misrepresents free market economics and is geared towards activism rather than serious enquiry.
Regardless of collectivist aspirations, this interview recognises that the essence of socialism is a centrally planned economy. Mack uses camping trips as a model of “the good society” but I think this suffers from three flaws. When it comes to a camping trip, the participants already know each other; everyone has consented to participate; and there’s no need to create resources (camping trips are primarily about consumption rather than production. If you want to drink a beer, you bring it with you having paid for it with previously expended labour). This reveals that most socialist visions are utopian and don’t solve the real world problems of how to create human flourishing in an extended social order. Ultimately, socialism is a collectivist philosophy that requires subjection of the individual to the whole. Therefore it should be rejected by anyone whose fundamental concern is the dignity and sanctity of the individual.
This interview makes clear that the main tragedy of socialism is that it is unintended. The results are inconsistent with the stated goals of the advocates, implying the problem is an intellectual one. Hence the need for scholarly enquiry and public education. They also recognise that a centrally planned economy may function better than a market economy during times of war, but this should not be the model. After all, a stable peace is as important a social objective as greater wealth. This interview also captures Pete Boettke’s biggest contribution to economics: in the absence of the “three P’s” of property, prices, and profit and loss you have to rely on political power to allocate resources. Therefore, a socialist society will be riddled with rent-seeking and the other inefficiencies associated with “politics without romance“, giving rise to the nomenklatura and priviledge. He also makes the point that prices are embedded in institutions, and institutions are embedded in broader social relations. We therefore need to understand law, politics and society, as a coherent social science. Finally, I like the point made that a free market economy lets ordinary people do extraordinary things. It doesn’t rely on extra ordinary people controlling and directing a vast bureaucracy.
Memoir of a British Journalist in Moscow, Cold War Conversations – an interview with a Morning Star journalist who provides a sympathetic view on life under communism.
This webpage gathers some key resources to help you understand what a NGDP target is, and why I think central banks should be more open to adopting them. I am convinced that delivering macroeconomic stability should be the prime objective of any central bank, and that an NGDP target would be a good way to achieve this. Let’s see why…
What is an NGDP target?
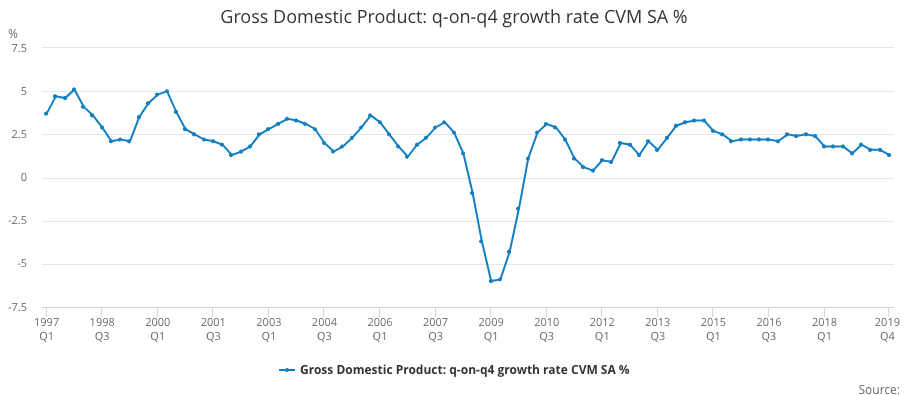
You probably know that GDP stands for Gross Domestic Product. This is the conventional way of measuring economic activity, and reveals the market value of final goods. When we’re interested in whether people are getting richer or poorer, we look at real GDP, which strips out the effects of inflation. This allows us to make meaningful comparisons about the productive performance of an economy across different time periods, and the chart below shows what’s happened to GDP in the UK from 1997-2019:
Source: ONS (Gross Domestic Product: q-on-q4 growth rate CVM SA % (IHYR))
The real growth rate for the UK from 1949-2019 averaged 2.5%, but more recently it seems to be below this. While this may be a concern, in normal times it is driven by factors outside the control of central banks (such as the productivity of labour and capital).
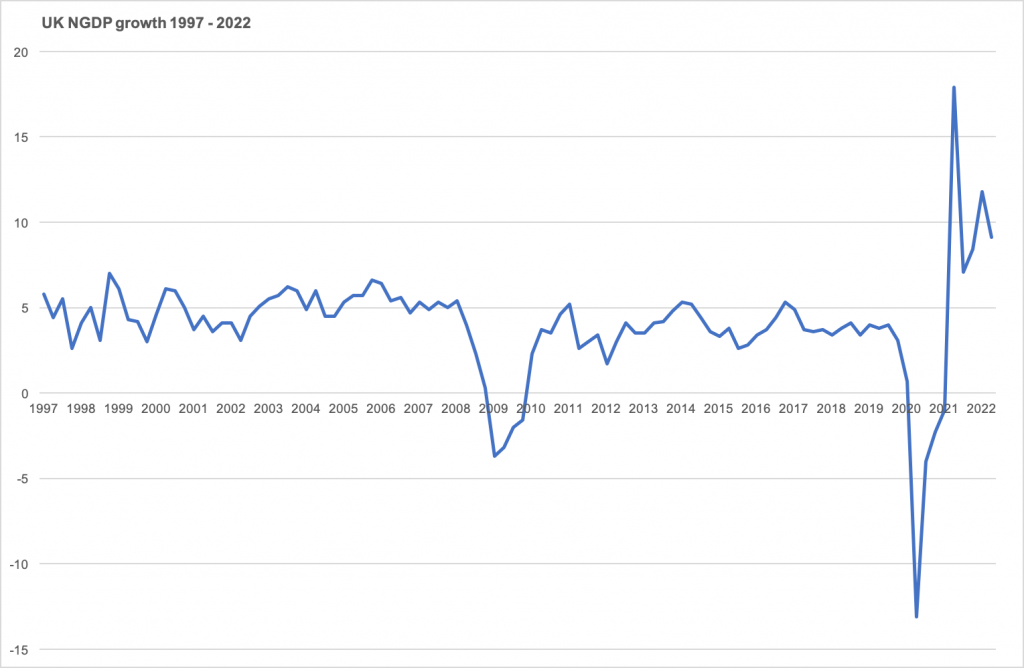
Central banks do, however, have a large influence over the nominal growth rate, which is the cash value of economic activity (i.e. without stripping out the effects of inflation). The chart below shows annual NGDP growth from 1997-2022.
Source: ONS (Gross Domestic Product: q-on-q4 growth quarter growth: CP SA % (IHYO))
Notice a few interesting things:
Prior to the global financial crisis (i.e. from 1997-2008) it was fairly stable at around 5%.
It significantly contracted during the global financial crisis.
From 2011-2019 it was slightly more volatile and a slightly lower rate (averaging below 4%).
It was extremely volatile during the covid pandemic and recent energy shocks.
Now, here are the big claims I wish to make:
(i) The reason that economic performance was reasonably good from 1997-2008 was because NGDP growth was stable.
(ii) The subsequent and more recent poor performance was due to having left that 5% growth path.
What do central banks do?
Most central banks utilise an inflation target, where their primary objective is to deliver low and stable inflation. And this is how we typically judge whether they are doing their job. For example,
The European Central Bank is supposed to deliver “price stability”, which they believe is “best maintained by aiming for 2% inflation over the medium term”.
However, many economists question whether this is the best way to conduct monetary policy. Instead of trying to keep consumer prices stable and assume that other important variables will follow from that, an NGDP target aims for a stable environment for all wage and debt contracts, because labour and credit markets are more important for economic planning than a specific set of consumer prices. Indeed, NGDP is less volatile than CPI, and NGDP is more relevant for concerns about debt sustainability.
It is therefore interesting to see that even back in 2012 NGDP targets were receiving attention from important central bankers:
The former governor of the Bank of England, Mark Carney (see here)
The former chair of the Federal Reserve, Janet Yellen (this speech has been widely interpreted to incorporate attention to NGDP growth in policy decisions)
Some theory
Consider the following “equation of exchange” (where each variable refers to a growth rate):
M+V=P+Y
The power of this equation is that it rests on a tautology, which is that the total spending across the entire economy must be equal to total receipts. That being the case, we can break down total spending into two components: the amount of money that is available to spend (M), and people’s desire to spend the money already in circulation (V). Spending rises when more money gets created, or if people choose to spend more of what they already have. Central banks therefore stimulate the economy either by Quantitative Easing (more M) or reducing interest rates (more V). This “total spending” is sometimes referred to as aggregate demand, but notice that it is equal to the combined rate of inflation (P) and real GDP growth (Y). It is through their ability to determine the amount of aggregate demand that central banks will directly affect nominal GDP (P+Y). And since one person’s expenditure is another’s income, another term for NGDP is nominal income.
For more on using this equation as a foundation for understanding macroeconomic policy objectives and performance, see here.
Some history
Nominal income targets first became popular in the 1980s, when the prevailing focus was targeting the money supply (as pointed out in this presentation by Jeff Frankel). Some big name economists gave them attention, including in the following famous articles: (for a longer list see here)
This second wave has come in the context of perceived failures of inflation targets.
We can therefore witness a steady evolution in thought: perhaps instead of being bound by a money growth rule (M), or an inflation target (P), the central bank should instead target nominal income (P+Y). This means that real productivity will determine the split between inflation and real growth – if productivity is strong then inflation will be low, but when there’s a real business cycle slow down inflation is permitted to rise. These adjustments will take place such that NGDP remains stable. This video by MoneyWeek does a nice job explaining how this balancing act is already part of the Fed’s perview:
The increased influence of NGDP…
Scott Sumner has been described by The Atlantic as “the blogger who saved the economy” due to the influence he had over the Fed’s late 2012 QE3 program. You can see a great overview of the rise of Sumner here:
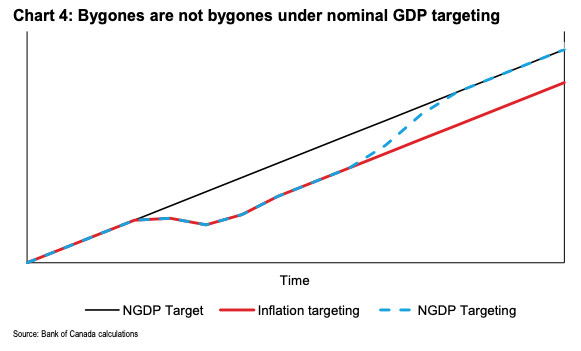
A key thing that he emphasises is that it’s not just the fact the nominal income is a more important variable for macro stability than price stability, but that the expected growth path of a variable is more important than a rate. In other words, if a central bank “misses” a 2% target the question is whether it tries to get back to 2% and consider that enough, or whether they try to get back to where things would have been had the 2% growth path continued. In technical terms NGDP advocates want a level target and, as Mark Carney’s chart below shows, to not let bygones be bygones.
(Astute readers will point out that you could have an inflation level target and achieve the same result, which is indeed the case. But for simplicity we compare the status quo inflation growth rate target and the potential NGDP level target).
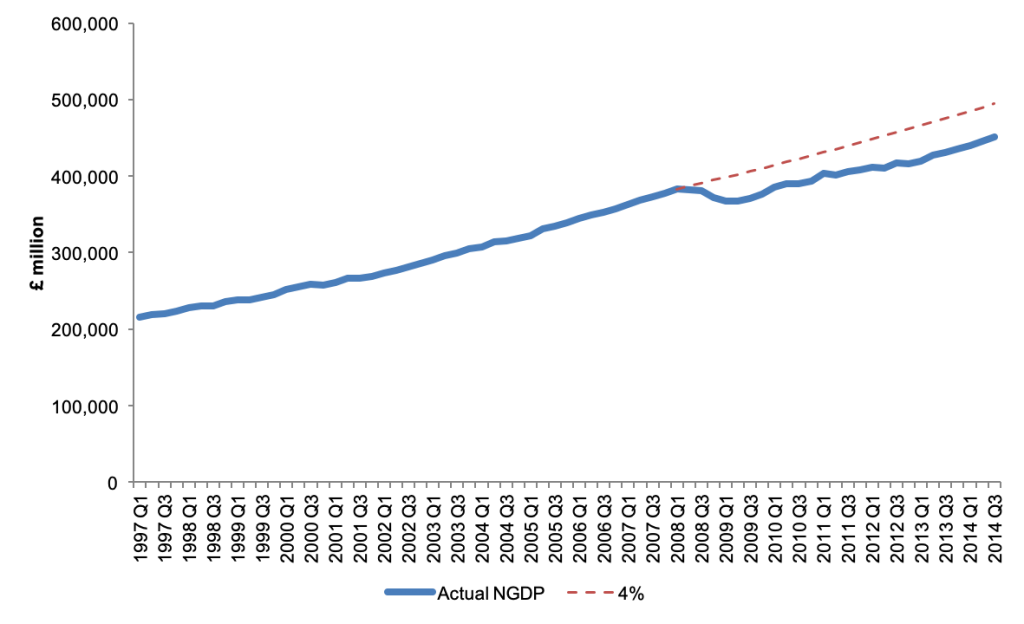
So even though thinking in growth rates is easier to communicate, the power of an NGDP level target is best shown when we look at absolute units. And as the chart below shows the UK deviated from a hypothetical 4% growth path and failed to catch back up again. That NGDP gap represents a permanent loss of economic activity relative to the public’s prior expectations, and forces an unnecessary and painful slowdown.
Source: ONS, own calculations
NGDP targets: pros and cons
We shouldn’t expect a perfect tool for managing the economy, so in this section I want to summarise what I consider to be the three strongest reasons in favour of NGDP targets, and also the three strongest arguments against.
Three good reasons in favour:
They are good at dealing with supply shocks. An inflation target fails to reflect the reasons for inflation to either be above or below target, and therefore send dangerous signals to policymakers. If inflation is low because of a lack of demand, we need central banks to step in. But if inflation is low because of productivity improvements, then increased purchasing power is exactly what we want. Similarly, if too much aggregate demand is causing higher prices we want central banks to cool things down. But if a negative real shock is prompting prices to spike, the last thing we want is reduced spending, which which compound the negative economic activity. By asking central bankers to “see through” temporary inflation we’re expecting them to be able to make a judgment about the source of inflation. An NGDP target avoids having to do this – by keeping nominal income stable you let the price level adjust automatically to changes in productivity.
They promote financial stability. A big macroeconomic danger is that when debt burdens become unmanageable this tends to affect wide parts of the economy and has negative knock on effects. A NGDP target means that in a recession inflation will increase and this will erode some of the real value of those debt burdens. People tend to borrow a nominal amount, and inflation means that you pay back less, in real terms, than you otherwise would. This eases the consequences of high debt burdens.
They promote monetary neutrality. If V is people’s desire to spend money then we can recognise that it is the inverse of people’s desire to hold money, i.e. the demand for money. Like any market, equilibrium occurs when the demand and supply are able to adjust, and when it comes to money we want supply to adjust to changes in demand. Monetary equilibrium is therefore a consequence of NGDP stability. This also will keep interest rates at their “natural” rate, which is when the demand and supply of loanable funds is equal. Rather than using monetary policy to deliver an arbitrary inflation target, an NGDP target approximates a much more important macroeconomic objective: neutrality. It provides a platform where demand and supply interact, providing a stable and meaningful context for economic activity to take place.
Three good reasons against:
National income data isn’t ready yet. Reasonably accurate estimates of CPI are released every month. GDP by contrast tends to be available each quarter and subject to large revisions. Indeed some people argue that policy mistakes in 2008 were more due to the fact that GDP data was faulty rather than a blind commitment to an inflation target. But even if we had quicker estimates of GDP this isn’t necessarily what we should be focused on. Not all economic transactions are captured in GDP figures, which is a sort of middle ground between a measure of pure consumption of final goods (i.e. no capital goods at all) and the entire capital stock. It serves a useful purpose, but is hardly an accurate measure of what we actually care about. Some would argue that the “correct” form of the equation of exchange is M+V=P+T, where T refers to all economic transactions. But if we include financial transactions in our analysis, the real economy becomes virtually irrelevant. So perhaps a focus on payments data or “average weekly earnings” may be better suited to our objectives than GDP.
It will lead to greater inflation volatility. By switching to a NGDP target policymakers will be less inclined to ensure a stable rate of inflation. It’s debatable how successful they have been at delivering a low, moderate rate of inflation, but less focus on this may well reduce performance even more. Especially since Y* is subject to change, the choice of NGDP target will lead to quite high variations in inflation. There will also be some confusion amongst the general public, because at the moment we use CPI as our standard measure. However the “P” in M+V=P+Y is not best measured by a basket of consumer goods, it should be the inflation rate that affects the component parts of our GDP calculation. This is referred to the “GDP deflator”. It has taken central banks many years to generate credibility around their ability to get the general public to expect 2% inflation. Switching to a more volatile outcome of a different measure might be hard to explain.
Not all economies are suitable. An NGDP target is best suited to larger economies, because smaller ones (especially if their are open to trade) are likely to be reliant on particular commodities. For example, for small open economies (in especially those that are commodity exporters) if oil prices rise you would need to shrink the rest of the economy.
Working on NGDP targets
In May 2013 I organised a conference in Copenhagen, hosted by Danske Bank. It involved Lars Christensen as well as Sam Bowman and Ben Southwood from the Adam Smith Institute. Lars coined the term “Market Monetarism” and became known as an early and influential advocate via his famous blog, “The Market Monetarist“. Sam advocated an NGDP target in a letter published by the Financial Times in 2014. And here is a nice video of Ben Southwood explaining how a NGDP target would mean that central banks don’t have to try to work out which shocks to respond to and which to ignore:
Also around this time, in 2016, the ASI published my policy report, Sound Money, which contained an NGDP proposal for the UK.
Some of the key questions to address when considering an NGDP target are as follows:
Should it be a growth rate target or a level target?
Should it be set at a high rate (which gives monetary policy more room to manoeuvre, and requires less of an adjustment from nominal wages in a downturn) or a lower rate (which permits mild deflation when productivity is high, and has less distortions on non-indexed factors such as taxes on capital)?
Should it focus on GDP or some other measure of economic activity such as transactions, or something like Average Weekly Earnings?
Should it focus on GDP/T/AWE as whole or adjusted for population growth (i.e. on a per capita basis)?
Considering all of these factors, I advocated a 2% average growth in NGDP expectations over a 5 year rolling period. The mains reasons were:
It retains the public’s understanding of real GDP and inflation in terms of growth rates, not levels
5 years is a long enough time period to be a de facto level target
5 years is a short enough period to fit into the political cycle (and therefore generate some short term accountability)
A 2% rate hedges against central bank incompetence at the zero lower bound
A 2% rate provides a small cushion against deflation (which rightly or wrongly is politically dangerous)
A 2% rate is low enough to permits a mild deflation whenever productivity grows above 2%
It avoids the need (for now) to set up complicated futures market
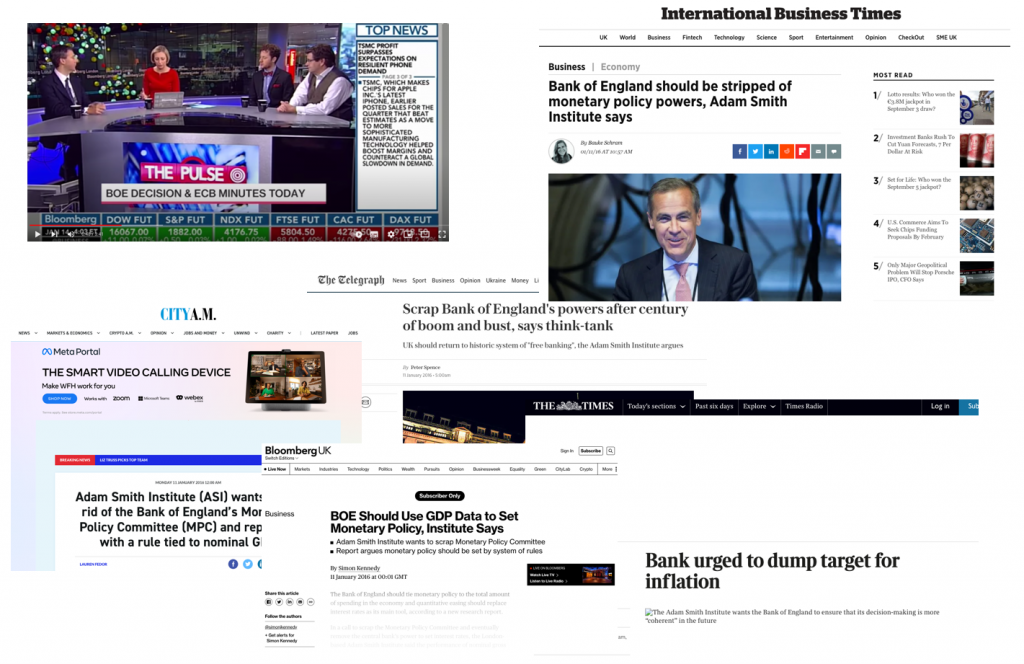
My proposal was trying to strike a balance between those who advocate that total spending is stable (i.e. a 0% growth target) and those who take the current inflation target (2%) and the typical long term real growth rate (~2%) to create a 4% NGDP target. But this idea didn’t catch on, and in hindsight it’s probably better to go for one or the other. Regardless, I was delighted to see that the proposals received extensive media coverage:
It’s more than just a NGDP target
My ASI proposal discussed NGDP targets within the context of wider reforms. I viewed an NGDP target as a step in the right direction away from arbitrary and discretionary monetary policy decisions, and toward a more automated, rule-based system. Some important additional elements relating to implementation included:
It places a focus on monetary base (which, ultimately, is all that the CB controls)
It makes open market operations (OMO) the routine monetary policy tool (rather than interest rates)
It can strip away a lot of distortionary CB activity
It uses forecasts and market expectations (possibly through futures contracts) rather than historic data
It can be tied to some automatic mechanism, become a rule, and eliminates discretion entirely
A flexible average inflation target is one way to permit NGDP playing a role without the embarrassment of abandoning an inflation target.
The Fed’s decision to cut interest rates in 2019, despite inflation being high, indicates an increased concern for market expectations (see falling inflation expectations here) and therefore a triumph of market monetarism. (Indeed market monetarists have been credited with having directly influenced the Fed’s decision to adopt average inflation targeting and use market forecasts when cutting interest rates in 2019).
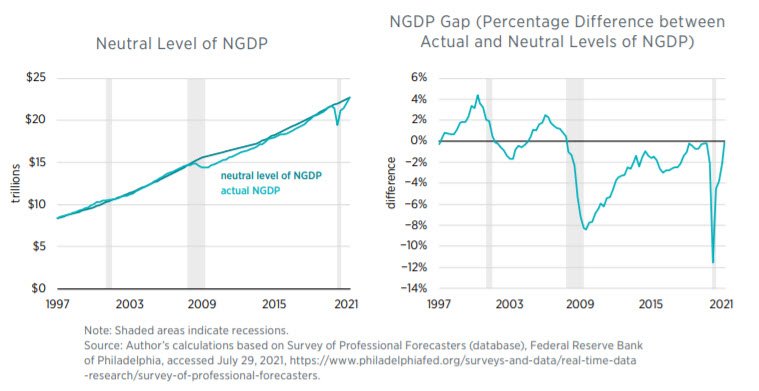
We’ve now got back to the pre-covid NGDP trendline (see David Beckworth’s charts, shown below) which is why this recession hasn’t prompted a debt crisis.
I don’t think this final point is appreciated enough – we’ve experienced a historically unprecedented collapse in economic activity and yet this didn’t have an immediate, obvious, and cataclysmic effect on the banking system, the housing market, unemployment, or corporate or personal bankruptcy levels. Had central banks repeated the mistake of 2008, and allowed NGDP growth expectations to fall, then the consequences would have been horrific. But they heeded the lesson, and reassured markets that NGDP would soon return to the previous trend path.
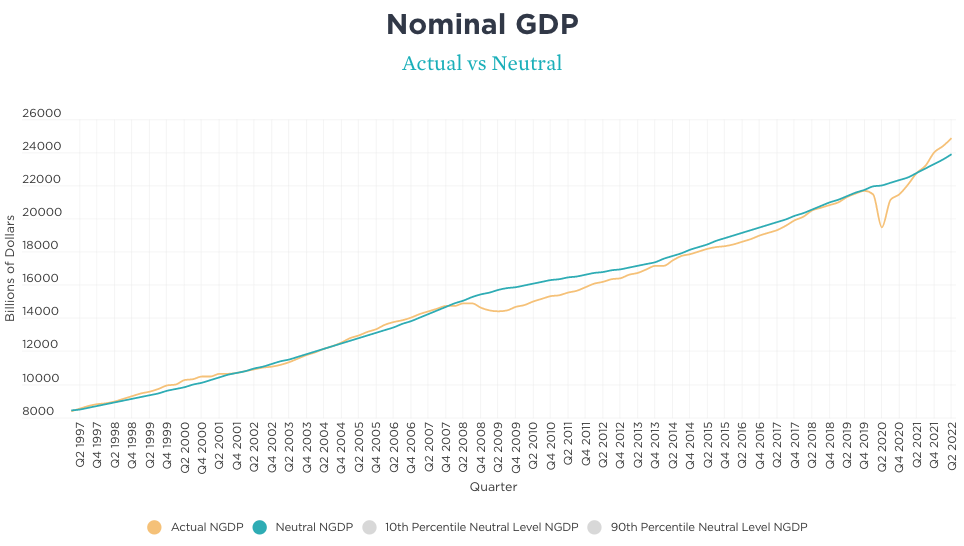
That said, if we look at the figures for 2022 we can see that according to David Beckworth’s excellent data set actual NGDP is now exceeding the amount it would be in order to be neutral. This suggests that the Fed are providing too much support, risking higher inflation and financial exuberance.
Source: David Beckworth. https://www.mercatus.org/publications/monetary-policy/measuring-monetary-policy-ngdp-gap
Whether or not central banks adopt an explicit NGDP target this data is playing a crucial role in our attempt to assess and inform policy decisions. I’m proud to have contributed to this research agenda.
The Fed Framework Review, Macro Musings, January 2025 – this is an edited collection of past shows that discussed NGDP targets.
Recommended video:
What can asset prices tell us about the great recession? Scott Sumner, February 2011 – a great way to see how Scott’s interpretation of events during the financial crisis were seen as idiosyncratic, but now look highly prescient.
The Role of the Fed, December 2012 – David Beckworth and Scott Sumber present a congressional testimony about market monetarism.
What does nominal GDP entail? IEA, August 2016 – a short interview with Scott Sumner about how expectations relating to nominal income grwoth are an important tool for central banks when interest rates are low.
What if I told you that we have access to a technology that generates, aggregates and communicates a vast array of information in a single and simple to understand metric? That throughout human history we have experimented with, developed and deployed institutions that convert a multitude of different perspectives into a common, universal language? And, perhaps most importantly, that our intuitions about it are usually wrong? This unit gives you the ability to recognise the beauty and power of market prices and see your business environment in a whole new way. We will consider the social function of markets and their impact on facilitating an extended order of cooperation. We will also consider the key challenges that business practitioners will need to overcome to ensure that humanity continues to reap the rewards of one of our greatest collective accomplishments.
Markets don’t approach or have the capacity to exceed human intelligence, they are even better than that – they are a virtual collective intelligence. This short course intends to convince you of this remarkable claim.
And, to demonstrate that I’m not a luddite, it is the only course I teach that deliberately incorporates AI generated content (the images above!)
***
This website collects a range of resources for you to work through at your own pace. But if you take the in person version:
“I, Pencil” (Leonard Read, 1958, Foundation for Economic Education)
“What is Seen and What is Not Seen” (Frederic Bastiat, 1850, Paris: Guillaumin. This version taken from The Bastiat Collection, 2nd Ed., Mises Institute, 2007, pp. 1-11 only)
To make things easier, I have republished them all in a single PDF file:
Chiang’s work of science fiction takes place in a world where AI have grown beyond human’s ability to comprehend them, and scientific endeavour is simply an attempt to interpret what “metahumans” are doing. In this world, these intellectually superior beings are benign (he pointedly comments that “unlike most previous low technology cultures confronted with a high technology one – humans are in no danger of assimilation of extinction) but have no interest in communicating effectively with people like us (and indeed when you consider our attempts to explain scientific progress to ants, why should they?). He considers a technology that might help individuals to upgrade their cognitive capabilities to bridge this divide, but recognises that people are quite cautious about exposing children to any gene therapy that might lead towards assimilation. His vision is a technologically optimistic one, but where humans are resigned to “catching crumbs from the table” – to feed off the scraps of our superior machines, where our attempt to merely interpret and make sense of their findings is our limit.
In his attempt to understand the financial market reaction to the UK government’s infamous mini-budget in September 2022, Ben Southwood (an Editor at Stripe Press, and a friend of mine) explains his affection for Chiang’s article. In doing so, he asks “Aren’t we already catching crumbs from the table?” Indeed, as the readings above demonstrate, the information content provided by market exchange is not always given to us in an entirely intelligible manner. We must interpret market data, and indeed speculate on what it means. Markets are arenas for such speculation to take place, and for contested claims to confront reality. Unlike an artificial intelligence, markets are a product of of human action, but they are not of human design. Markets help to assimilate dispersed and fragmented information into a single figure, which relates to an entire constellation of price signals. This communication system helps us to act and to plan, without having to understand where it has come from or what has happened to make it change. The implications are clear, but the interpretation is not. We struggle to make sense of what we see, despite the awe we should have for the system.
***
I remember hearing someone describe markets as “the first AI” and being impressed, but unconvinced by that declaration. Indeed here are some examples of people making an explicit link between markets and artificial intelligence. Firstly, Brad DeLong:
“There is no better way for harnessing the eight-billion-brain anthology intelligence of humanity to achieving the social goals we all want, other than to organize a well-functioning market system. That is a basic and serious truth.”
Brad DeLong (Conversations with Tyler. A similar quote can be found in his book ‘Slouching Towards Utopia’, 2022, p. 515)
And consider this quote by Paul Seabright (The Company of Strangers, 2004, p.15):
“Citizens of the industrialized market economies have lost their sense of wonder at the fact that they can decide spontaneously to go out in search of food, clothing, furniture, and thousands of other useful, attractive, frivolous, or life-saving items, and that when they do, somebody will have anticipated their actions and thoughtfully made such items available for them to buy. For our ancestors who wandered the plains in search of game or scratched the earth to grow grain under a capricious sky, such a future would have seemed truly miraculous, and the possibility that it might come about without the intervention of any overall controlling intelligence would have seemed incredible. Even when adventurous travelers opened up the first trade routes and the citizens of Europe and Asia first had the chance to sample each other’s luxuries, their safe arrival was still so much subject to chance and nature as to make it a source of drama and excitement as late as Shakespeare’s day.”
Mark Zuckerberg talks about how stock markets resemble AI here:
But markets go way beyond an “artificial” intelligence.
It is much more magnificent and mysterious: it is a virtual collective intelligence. One of the oldest in the world, and one of the most sophisticated social tools that man has ever created, our steps into the digital future might be trodden along a familiar path. How we understand and utilise markets are a useful way to practise and anticipate our relationship with the coming AI revolution.
“The market” isn’t a god or a weapon. It is neither something to worship nor something to deploy. It is an emergent and spontaneous order that helps us to solve social problems.
D. Markets in the age of AI
But what about the implications of AI for markets? Might modern technologies make markets obsolete? A hot topic in economics is whether improvements in big data and/or AI might alter the outcome of the socialist-calculation debate. Steve Horwitz explains that debate here:
The best book to read about the socialist calculation debate is:
Lavoie, D., 1985, Rivalry and central planning: The socialist calculation debate revisited, Cambridge University Press
Recent literature includes:
Foley, D.K., 2020, “Socialist alternatives to capitalism I: Marx to Hayek”, Review of Evolutionary Political Economy, Vol. 1, pp. 297-311
Foley, D.K., 2020, “Socialist alternatives to capitalism II: Vienna to Sante Fe”, Review of Evolutionary Political Economy, Vol. 1, pp. 313-328
Lopes, T.C., 2021, “Technical or political? The socialist economic calculation debate” Cambridge Journal of Economics, Vol. 45, Iss. 4, pp. 787–810
Piano, E.E., and Rouanet, R., 2020, “Economic calculation and the organization of markets” The Review of Austrian Economics, Vol. 33, No. 3, pp.331-348 – who make the point that we don’t know the optimal firm size without having market prices to guide us.
Xu, C., 2017, “Capitalism and socialism: A review of Kornai’s ‘Dynamism, Rivalry, and the Surplus Economy’, Journal of Economic Literature, Vol. 55, no. 1, pp. 191-208
In 2024, Peter Boettke, Rosolino Candela, and Tegan Truitt published a book on the ongoing relevance of The Socialist Calculation Debate. A key quote:
“Effective allocation of resources requires that there is a correspondence between the underlying conditions of tastes, technology, and resource endowments, and the induced variables of relative prices, quantities, and methods of production” (p.37)
According to a 2024 working paper by Cass Sunstein, “In important respects, the Socialist Calculation Debate and the AI Calculation Debate are the same thing.”
My view is that calculation problems can’t be solved through computation, and anyone who thinks that socialism is feasible either hasn’t read, or hasn’t understood, the four articles mentioned in this unit. Boettke et al (2024) write, “the whole point is that this has never been a computation problem. The knowledge is not “out there” and difficult to collect, but emergent only with the process itself and outside that context does not exist (p.60).
As Martin Wolf has said,
“Even in the age of big data, markets exploit knowledge and adjust incentives in ways that no other social media mechanism does” Martin Wolf (2023, p. 225)
Indeed, this isn’t a new debate at all. Good examples of papers claiming that AI or big data could replace markets include:
Cottrell, A., & Cockshott, P. (1993). Calculation, complexity and planning, the socialist calculation debate once again. Review of Political Economy, 51(1), 73–112.
Phillips, L., & Rozworski, M. (2019). People’s republic of Walmart. London: Verso.
And good rejoinders include:
Hodgson, G. (1998). Socialism against markets: A critique of two recent proposals. Economy and Society, 27(4), 407–433.
Here is a video on this topic featuring Bob Murphy:
Finally, in January 2025 the sudden popularity of Chinese AI app DeepSeek prompted a slump in US tech stocks. Read this BBC News report and consider the important role that market prices play in explaining what happened and why.
E. Conclusion
Markets are robust and powerful and in many cases using markets to try to solve a problem will make a massive contribution to actually doing so. What’s more, since most people’s intuitions about markets are wrong, we have immense potential to not only change people’s view of the world but also discover an important social tool.
“Markets: Beyond AI” was a resounding success, perfectly aligning with our mission by blending academic depth with practical relevance. Anthony expertly unraveled the complexities of market dynamics, illustrating how prices act as a vital mechanism for encapsulating intricate economic data to guide decision-making and spur innovation. His talent for making such a nuanced concept accessible and interactive was highly impressive. The workshop inspired and educated in equal measure.
Javier Gonzalez, Dept. of Economics, Universidad de Sonora, Hermosillo
G. References
Wolf, M., 2023, The crisis of democratic capitalism, Allen Lane
DeLong, J. B., 2022, Slouching towards utopia, Basic Books
In March 2022 I achieved a long standing ambition – to visit the world famous Dutch flower auction in Aalsmeer. I needed to teach on our Berlin campus and decided to take the Eurostar from London direct to Amsterdam. The Royal FloraHolland building is around 20km from Amsterdam Centraal with good bus routes and, of course, is easy to reach with Uber.
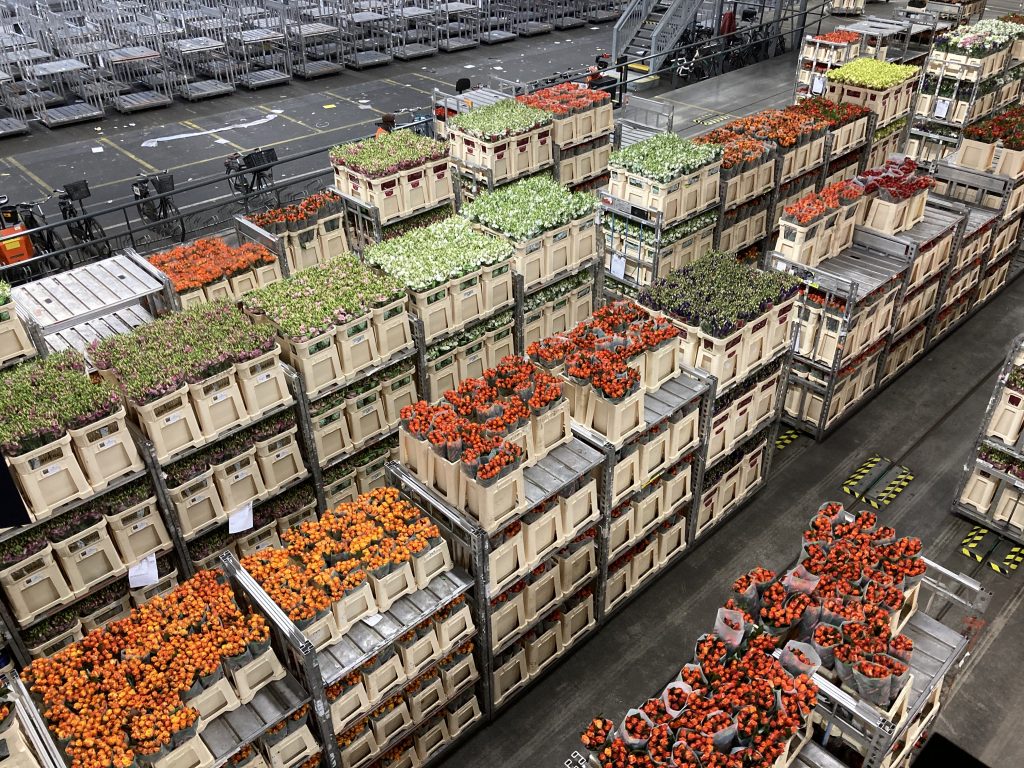
There are really two things that you visit here. The first is a market – you are essentially touring a big warehouse, which is the site for a large share of the global flower trade. But what makes this particular market so special is that it uses a Dutch auction method. While the most famous auctions like Christie’s and Sotherby’s are ascending auctions (the auctioneer gradually raises the price until there’s a winning bidder) the Dutch flower auction uses a descending one. This can often be quicker and therefore more suited to perishable items like fresh produce.
Having pioneered the flower industry in the 17th century, there are several reasons why the Netherlands became the dominant player:
Good growing conditions (tulips were first imported to region around 1570 and the sandy, coastal grounds are conducive for flower cultivation)
Good transport links (historically this was the river and canal system that linked the sea port to the heart of Europe, more recently this includes Amsterdam’s Schipol Airport, which since the 1960s has provided direct flights to important markets such as New York and Tokyo)
A strong financial centre (the Amsterdam stock market is the oldest in the world)
The Netherlands is one of the twenty largest economies in the world and is a leading global knowledge economy
Agriculture and food are one of the leading industries in the Netherlands and the flower cluster accounts for 43% of the global cut flower exports
The Netherlands accounted for over 80% of the flowers imported in Germany (30%), UK (21%), France (9.65), Denmark (2.7%), Switzerland (3.1%), Italy (4.3%), Austria (2.5%), and Poland (2,7%).
Unfortunately, I arrived too early and had to wait for the visitor centre to open:
The building is very large and the tour takes place along an elevated walkway – the first part is above some empty trolleys:
I wasn’t sure if these flowers were arriving or leaving but you can see that some of the logistic system is automated:
The overhead shuttle system allows sold flowers to be carried outside the premises, and avoid having to be loaded and unloaded onto vehicles:
Some of the flowers are boxed up while some are open. Those in boxes are subject to inspection to ensure that buyers are receiving a quality product.
I really enjoyed watching the activity taking place – the scooter drivers wear headsets to tell them where to go:
I realised that I should have been recording in landscape – this is my favourite video, showing how markets look chaotic but lead to a spontaneous order:
Here are some key facts and figures:
This graphic shows that the biggest import country is Kenya.
Here is a time-lapse of the trolleys:
…”we’ve got to keep on moving”!
The buggies are electric and here’s where they get stored:
This is my favourite photo from the tour:
Here is my overview of how the auction mechanism works:
When I was touring the site, I thought that the physical auction room was no longer in use. Here is a photo of it:
In fact, the auction room is still used sometimes, it’s just that most of the traders who are on site prefer to access the system from their own back offices:
Right at the end of the tour I discovered the old auction room. This was used when all traders had to physically assemble on site.
At the end of the tour there’s an interactive exhibit to learn how the clock works. Here I am having a go:
This is the official Royal FloraHolland video showing how the Dutch clock works:
Right at the back of the hall is a loading area:
After the tour I reflected on the relevance of the auction within the broader Dutch flower cluster:
Finally, here is the new trailer for Royal FloraHolland. Do you think I managed to get a ride on the trolleys??
I hope you enjoyed the tour!
You can test you knowledge of the Dutch flower auction with this quiz:
More resources:
Porter, M.E., Ramirez-Vallejo, J., and Van Eenennaam, F., ‘The Dutch Flower Cluster’, Harvard Business School Case No. 9-711-507, November 2013 (and teaching note).